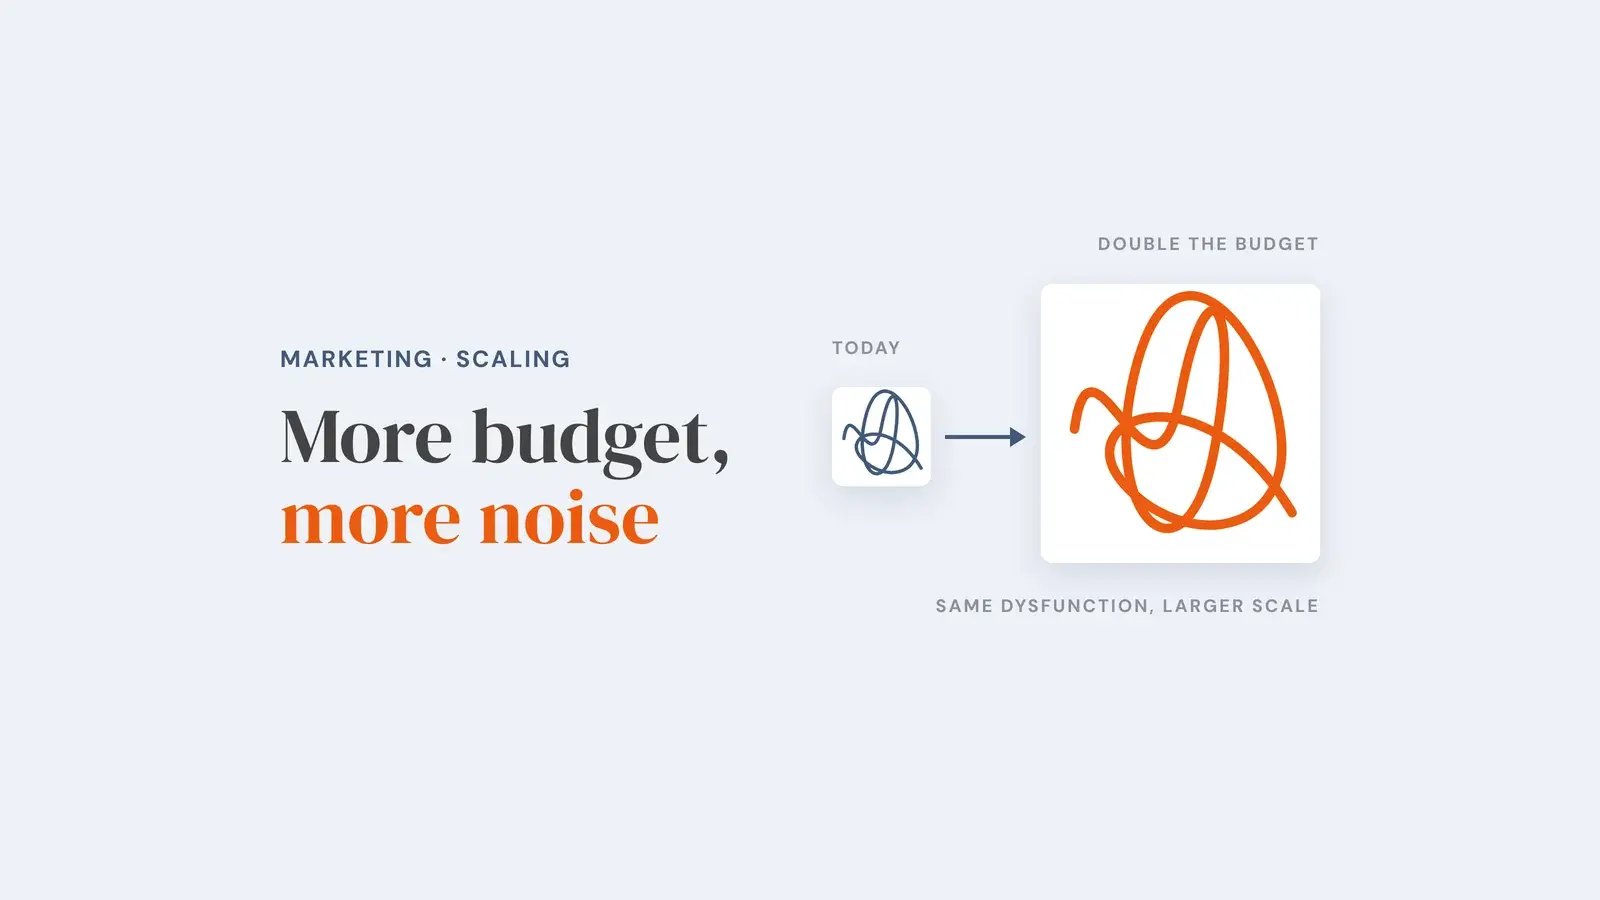


Your marketing report arrives on the same day each month. Traffic is up. Impressions are up. Lead numbers look healthy. And yet revenue has not moved in two quarters.
I have sat in that meeting from both sides of the table, inside agencies producing the report and inside founder-led businesses trying to work out what it meant. The gap between a rising report and flat revenue is not bad luck. It is structural, built into how the reporting was designed.
This article explains the difference between activity and revenue reporting, what each costs, where each is the right choice, and how to tell which one your provider is running.
Key takeaways
- Activity reporting measures effort: impressions, clicks, published content, lead volume. Revenue reporting measures outcome: pipeline created, deals closed, cost per acquired customer.
- Activity metrics can rise every month while revenue stays flat, which is why they mislead when they are the only lens.
- Revenue reporting needs clean CRM data and a qualified-lead definition agreed with sales. It is not free, and it has blind spots of its own.
- The fastest diagnostic is one question: "which of these numbers connects to closed revenue, and how?"
- Activity reporting is the honest choice in three situations, but not as a permanent format.
What is the difference between activity reporting and revenue reporting?
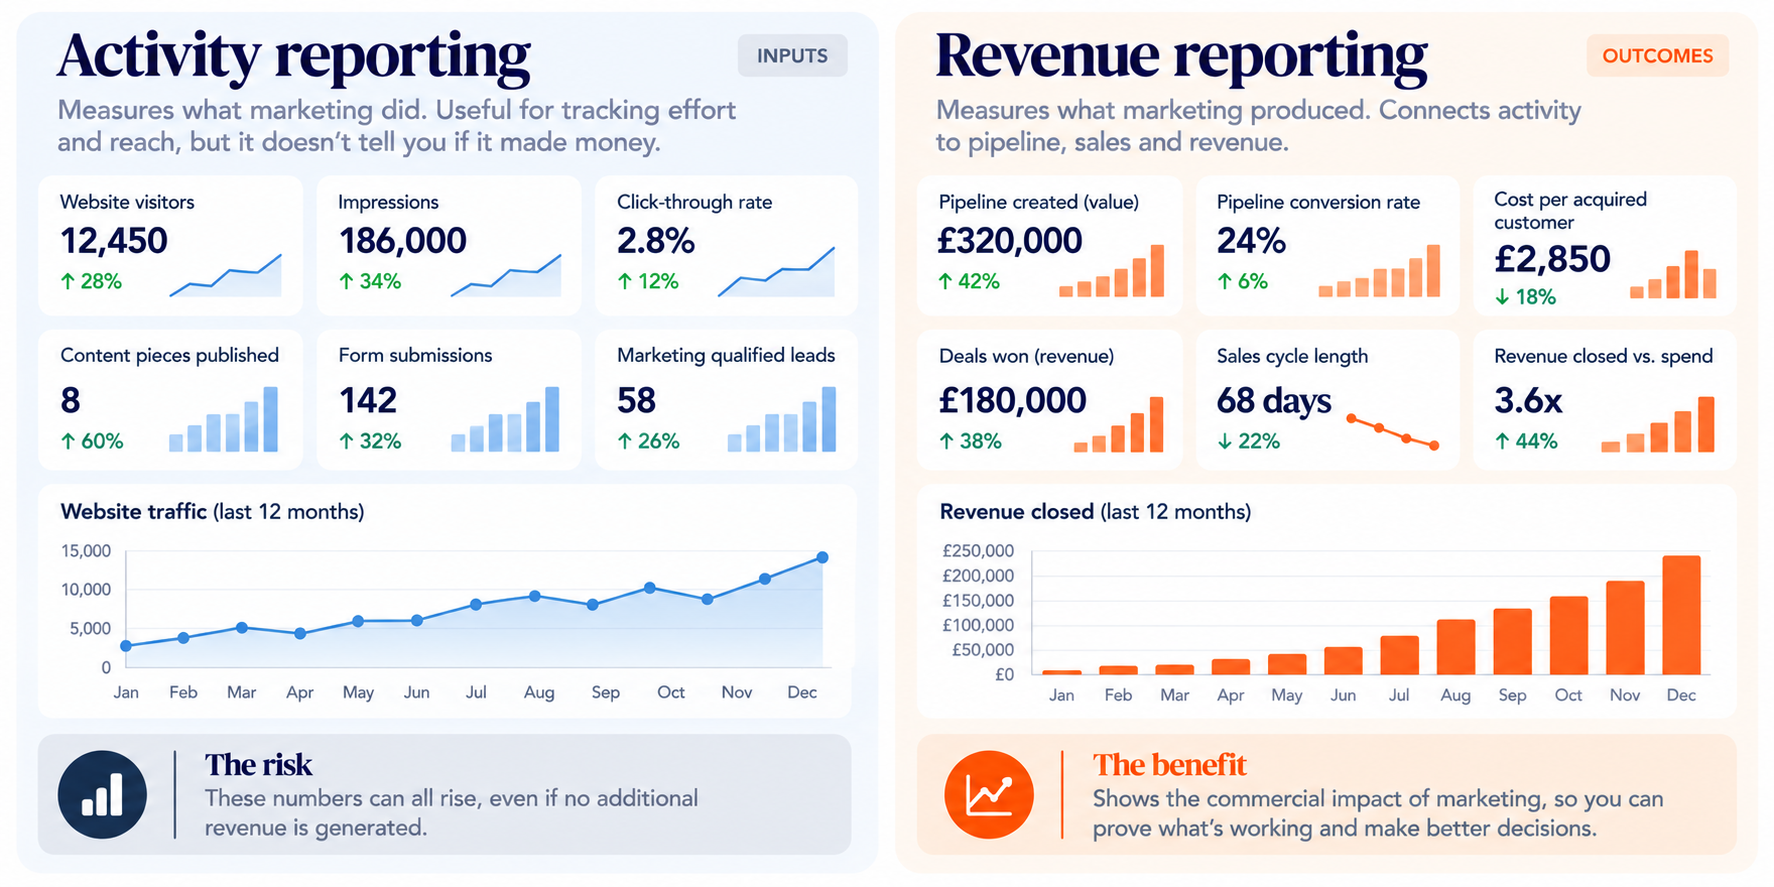
Activity reporting measures what marketing did. Revenue reporting measures what marketing produced. Both use real numbers, which is why the difference is so easy to miss on a dashboard.
Activity reporting counts inputs: sessions, impressions, click-through rates, posts published, forms completed, marketing qualified leads. Revenue reporting counts outcomes: pipeline by source, deals won, revenue closed against spend.
| Activity reporting | Revenue reporting | |
|---|---|---|
| What it counts | Inputs and signals | Pipeline and closed revenue |
| Question it answers | "What did we do?" | "Did it make money?" |
| What it is good at | Fast, early feedback on effort and reach | Connecting spend to commercial outcome |
| What it hides | Whether any of it converted | Brand-led demand, word-of-mouth, and long-cycle influence that never touches a tracked source |
| Setup required | Almost none | CRM hygiene, sales agreement |
Why does activity reporting look so convincing?
Activity reporting looks convincing because every metric in it can rise without anything improving for the business. Traffic, impressions and lead counts are measurable and growing in most accounts. None of them are load-bearing.
Publish more, and impressions rise. Widen a form definition, and lead volume rises. Neither tells you whether a single additional customer arrived.
An upward line is the easiest chart to produce when the number behind it has no ceiling. I have written before about how agencies use vanity metrics to hide poor performance, and it is rarely deliberate deception. It is a format never designed to answer a commercial question.
What does revenue reporting actually measure?
Revenue reporting measures the small number of figures a business can act on. Anything not traceable to one of them is context, not a result.
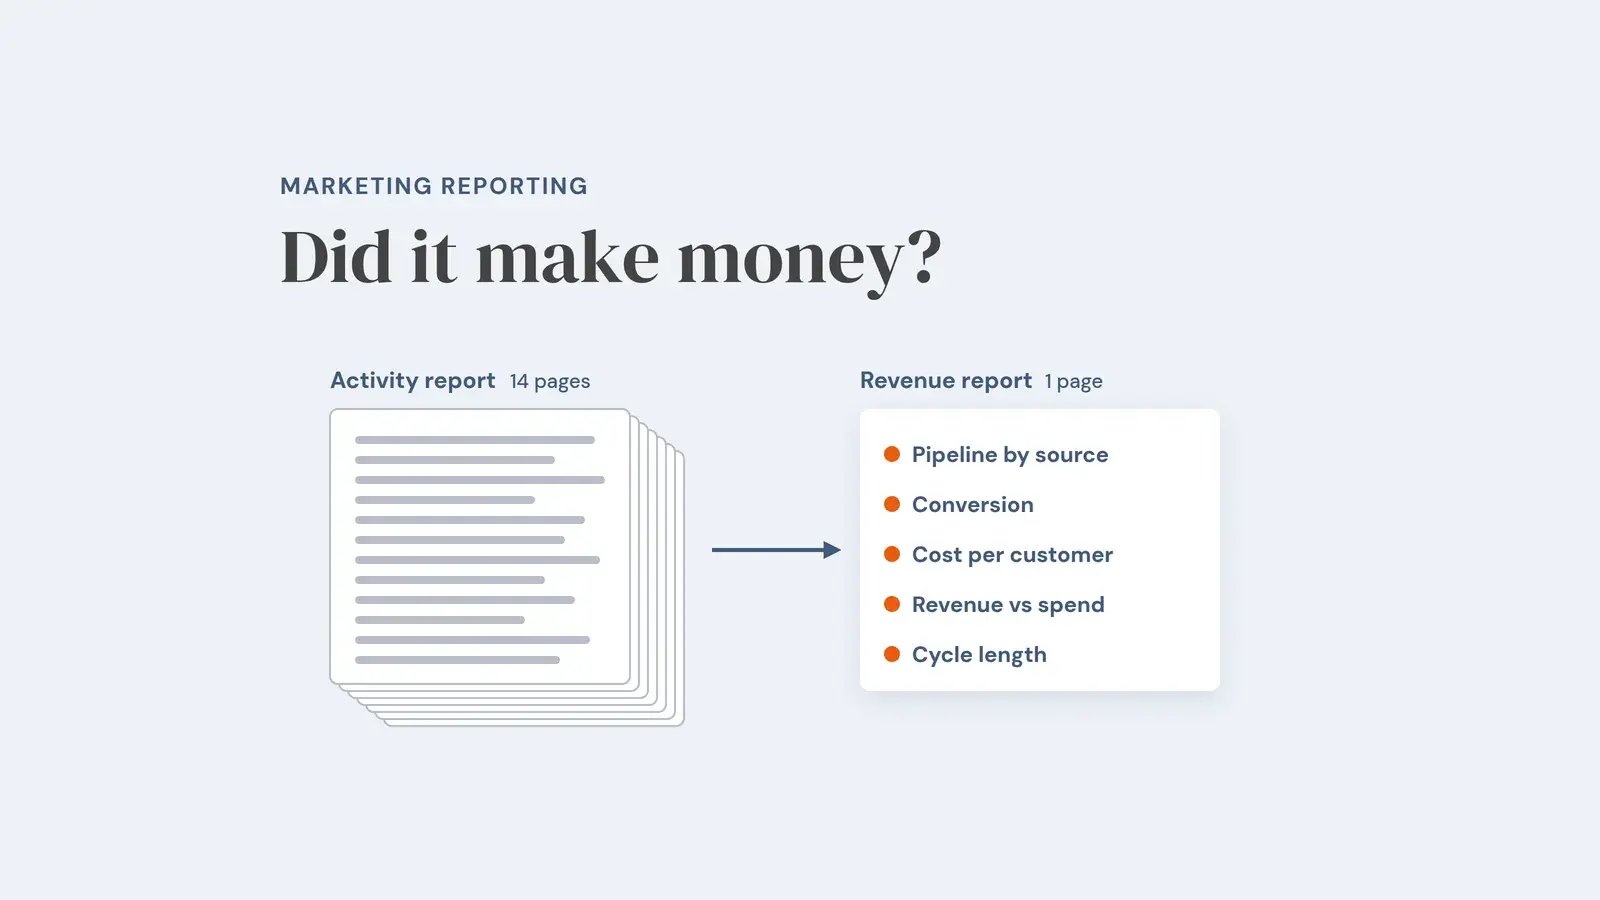
- Pipeline created by source: the value of qualified opportunities, by origin.
- Stage-to-stage conversion rate: where deals progress and where they stall.
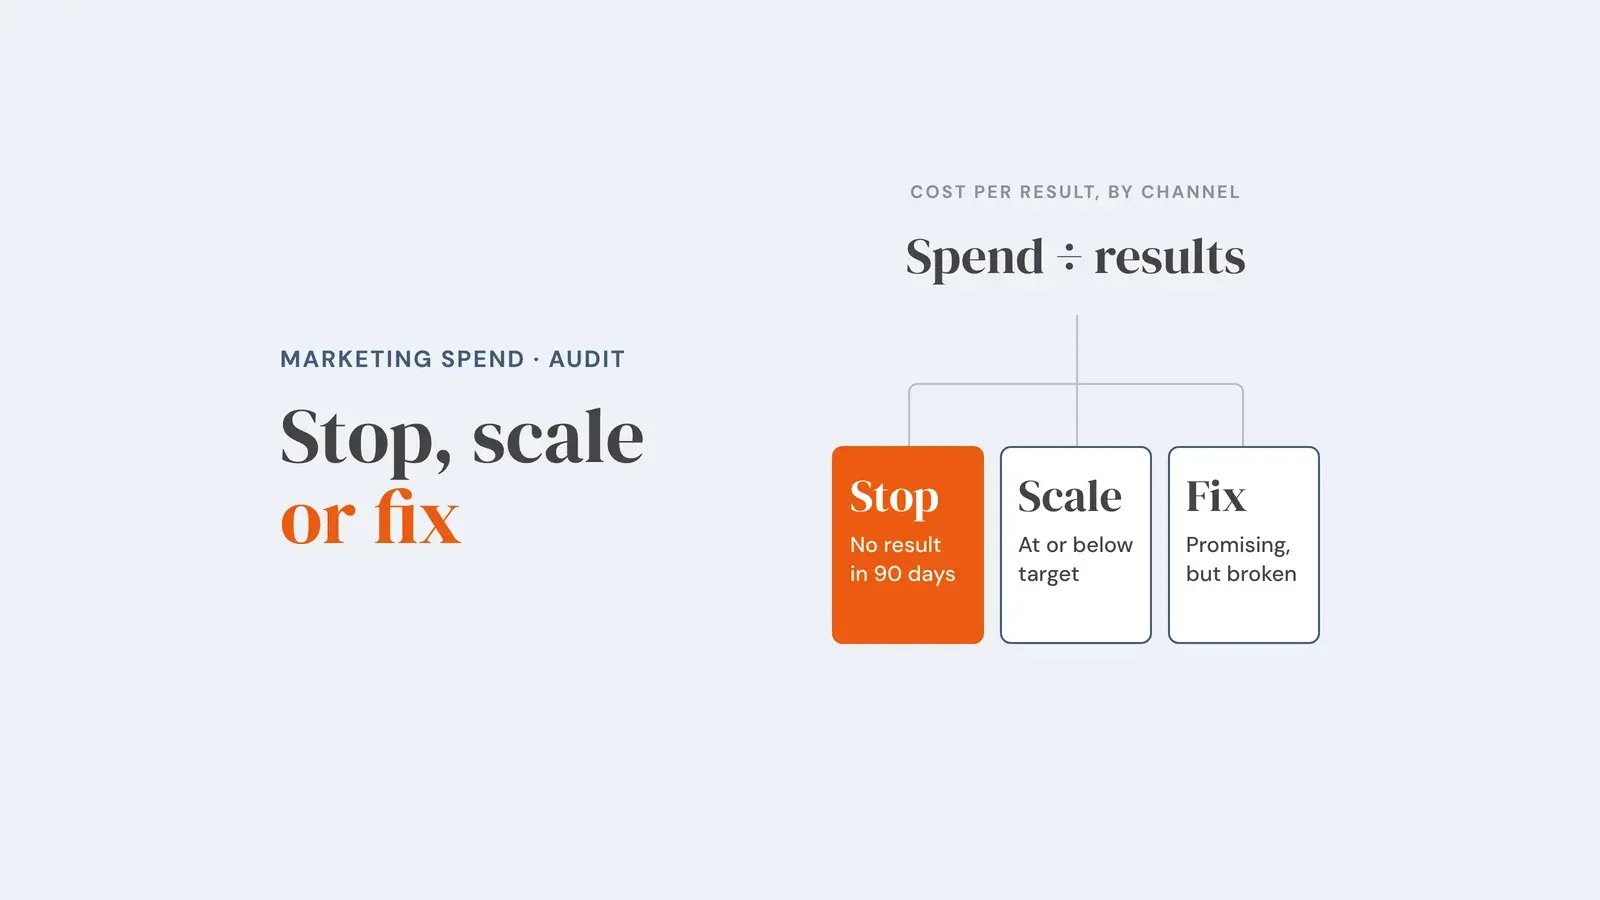
- Cost per acquired customer: marketing spend divided by customers won that period.
- Revenue closed against spend: money in, set against money out.
- Sales cycle length: and whether content is shortening it.
Five figures is usually enough. A 14-page report is rarely more honest than a one-page one.
What does each model cost you?
The real cost of activity reporting is delay. You cannot prove a programme is failing until enough deals have failed to close, and by then you have funded several quarters of it.
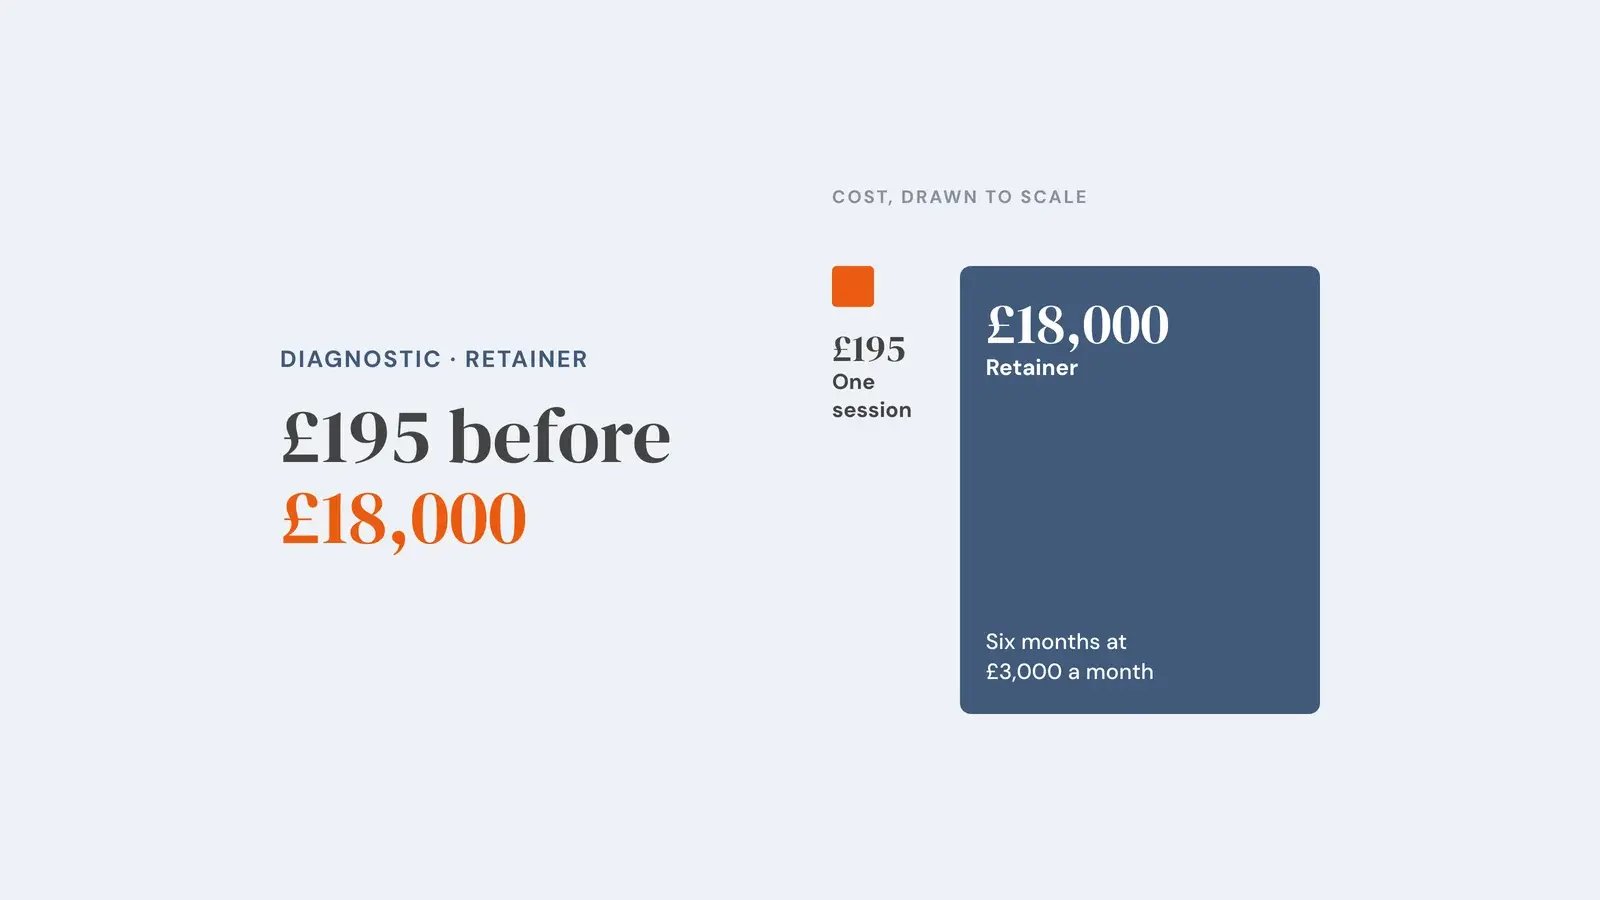
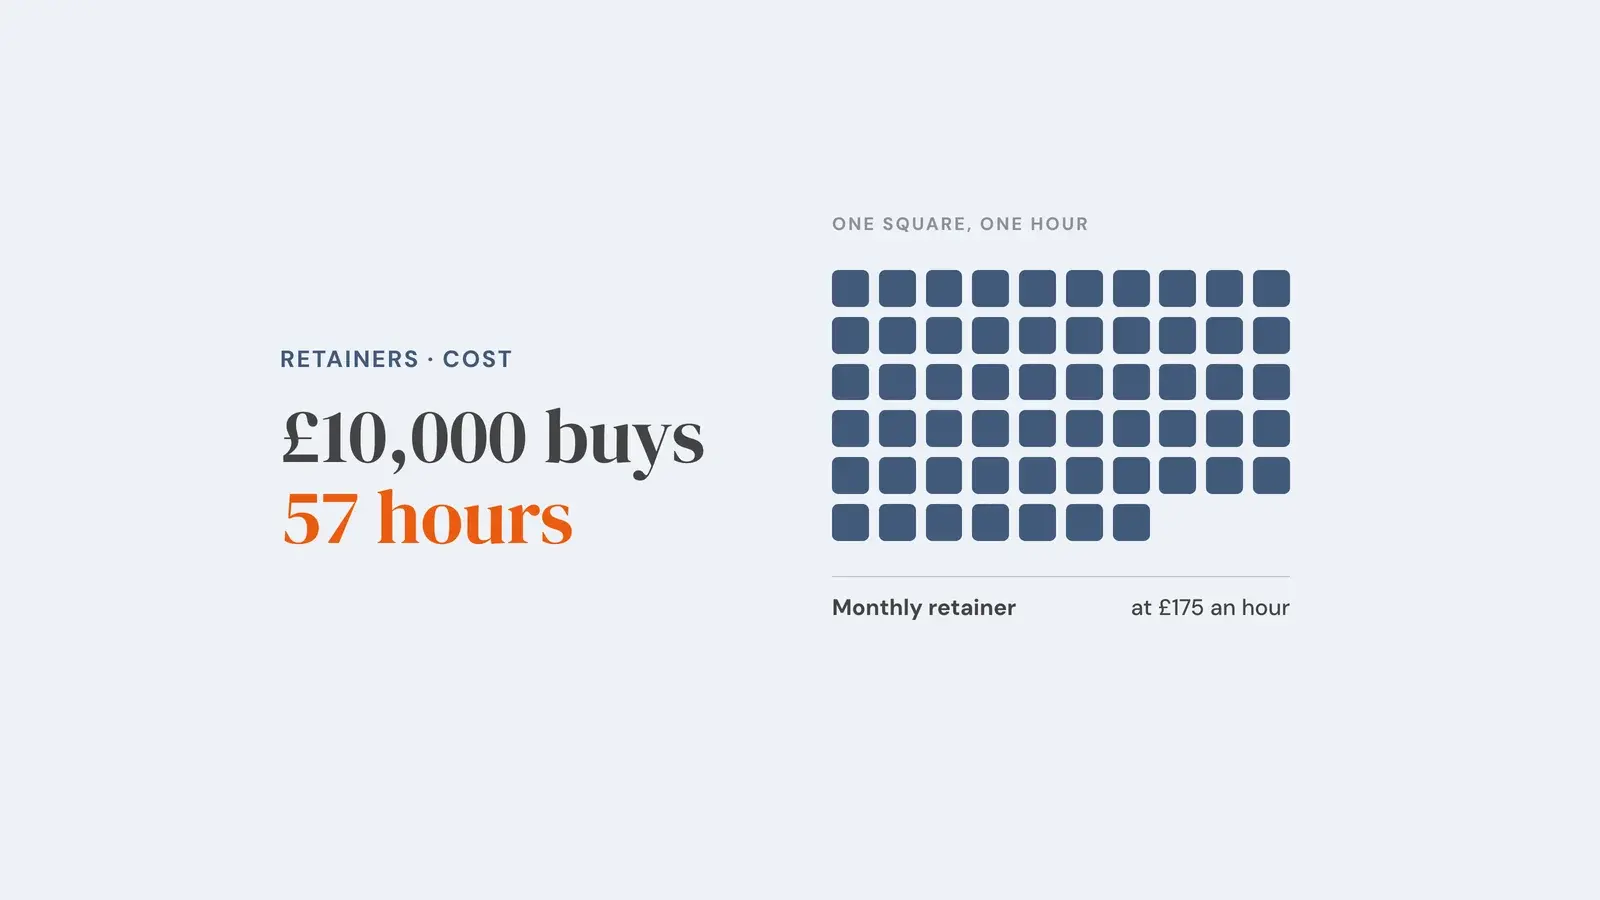
An illustrative example, based on the pattern I have seen across engagements rather than a published benchmark. A retainer at £5,000 per month ($6,500) costs £60,000 ($75,000) a year. If activity reporting delays your decision by nine months rather than three, the avoidable spend is roughly £30,000 ($40,000). Your numbers will differ; the shape rarely does.
Revenue reporting costs more upfront: a few weeks of CRM cleanup and a working session with sales, done internally or as a fixed-scope project rather than a new retainer. A one-off cost measured in weeks, against a recurring cost measured in years. My HubSpot strategy and implementation page (fixed fee) sets out what that work involves.
Where does activity reporting genuinely make sense?
Activity reporting is the honest choice in three situations.
In the first 60–90 days: There is not yet enough closed business to judge anything by. With a six-month sales cycle, demanding closed-won figures in month two is not rigour. It is impatience.
When there is no CRM to report from: If deal records do not exist, or sit in a spreadsheet nobody maintains, revenue reporting would be invention rather than measurement. Saying so is more honest than an attribution model built on nothing.
In channels where attribution is genuinely broken: Offline events, podcast sponsorship, print and most brand activity leave no clean trail. Forcing attribution there produces a confident number that is wrong.
All three are temporary or bounded. Activity reporting stops being legitimate the moment it becomes the permanent format for everything. If month 14 looks identical to month two, the reporting has not matured. It has calcified.
How can you tell which one your agency is running?
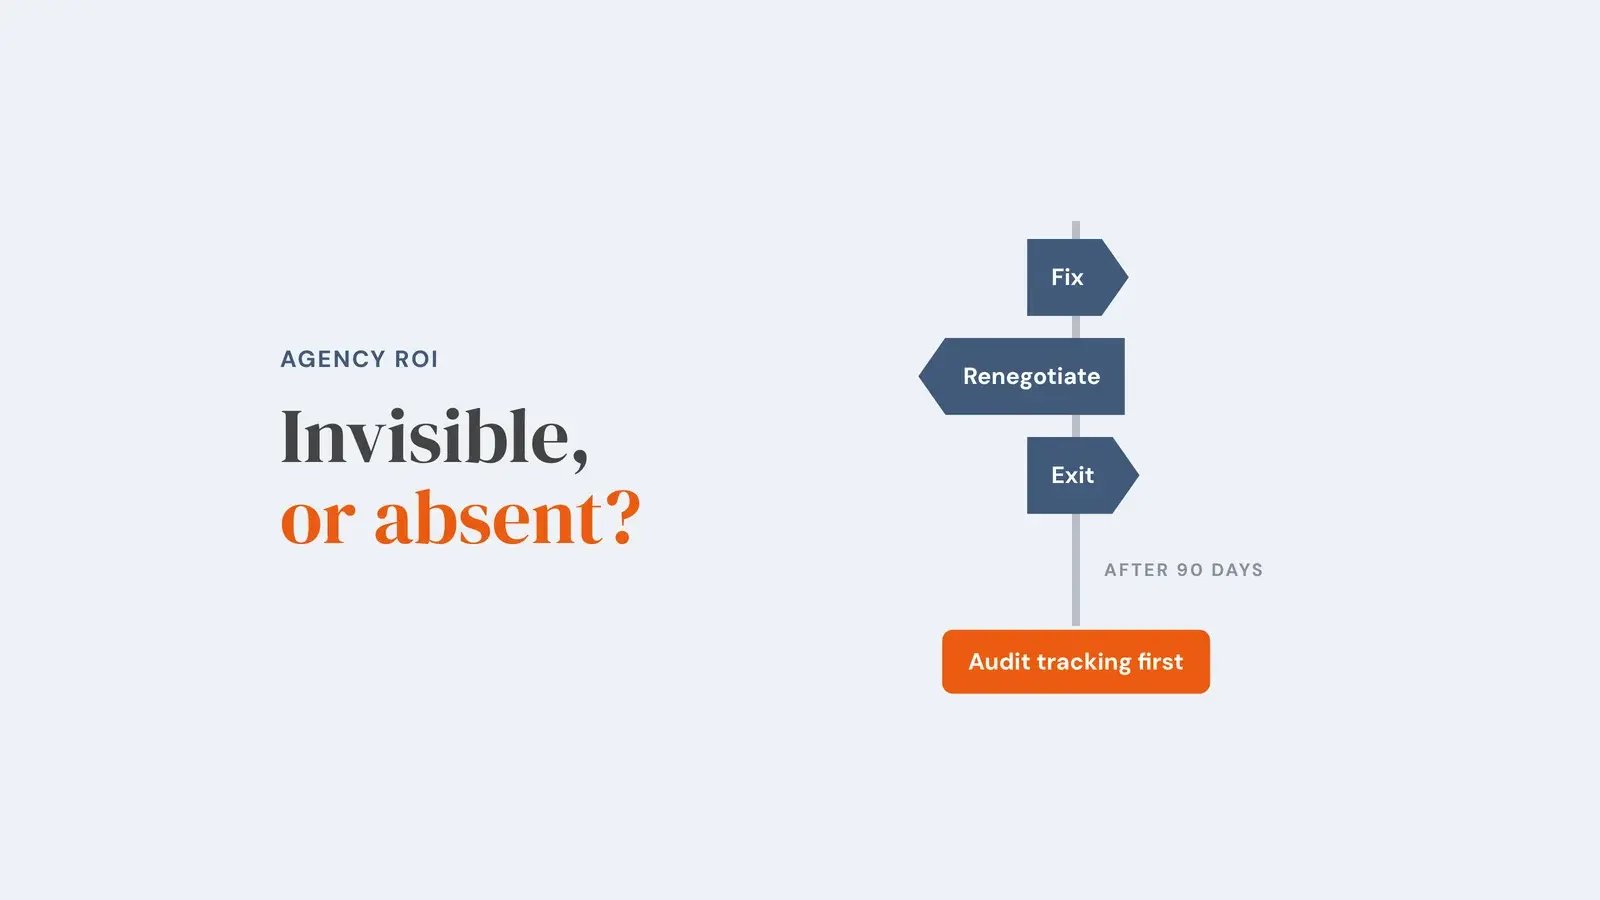
Ask one question: "which of these numbers connects to closed revenue, and how?" A revenue-linked report survives it. An activity report changes the subject to how difficult attribution is.
Attribution is genuinely imperfect, so judge the answer carefully. "We cannot attribute perfectly, here is our model and its limits" is fair. "Attribution is impossible, so we measure engagement instead" is not.
Five questions worth asking about your next report:
- Which sources produced qualified pipeline this month, and what was it worth?
- How many of last quarter's leads became customers?
- What did we spend to acquire each customer?
- Which number in this report would change next month's plan?
- If revenue is flat, what does this report say caused that?
If the answers arrive slowly or defensively, that is data too. I have covered the wider warning signs in agency reporting red flags.
How do you move from activity reporting to revenue reporting?
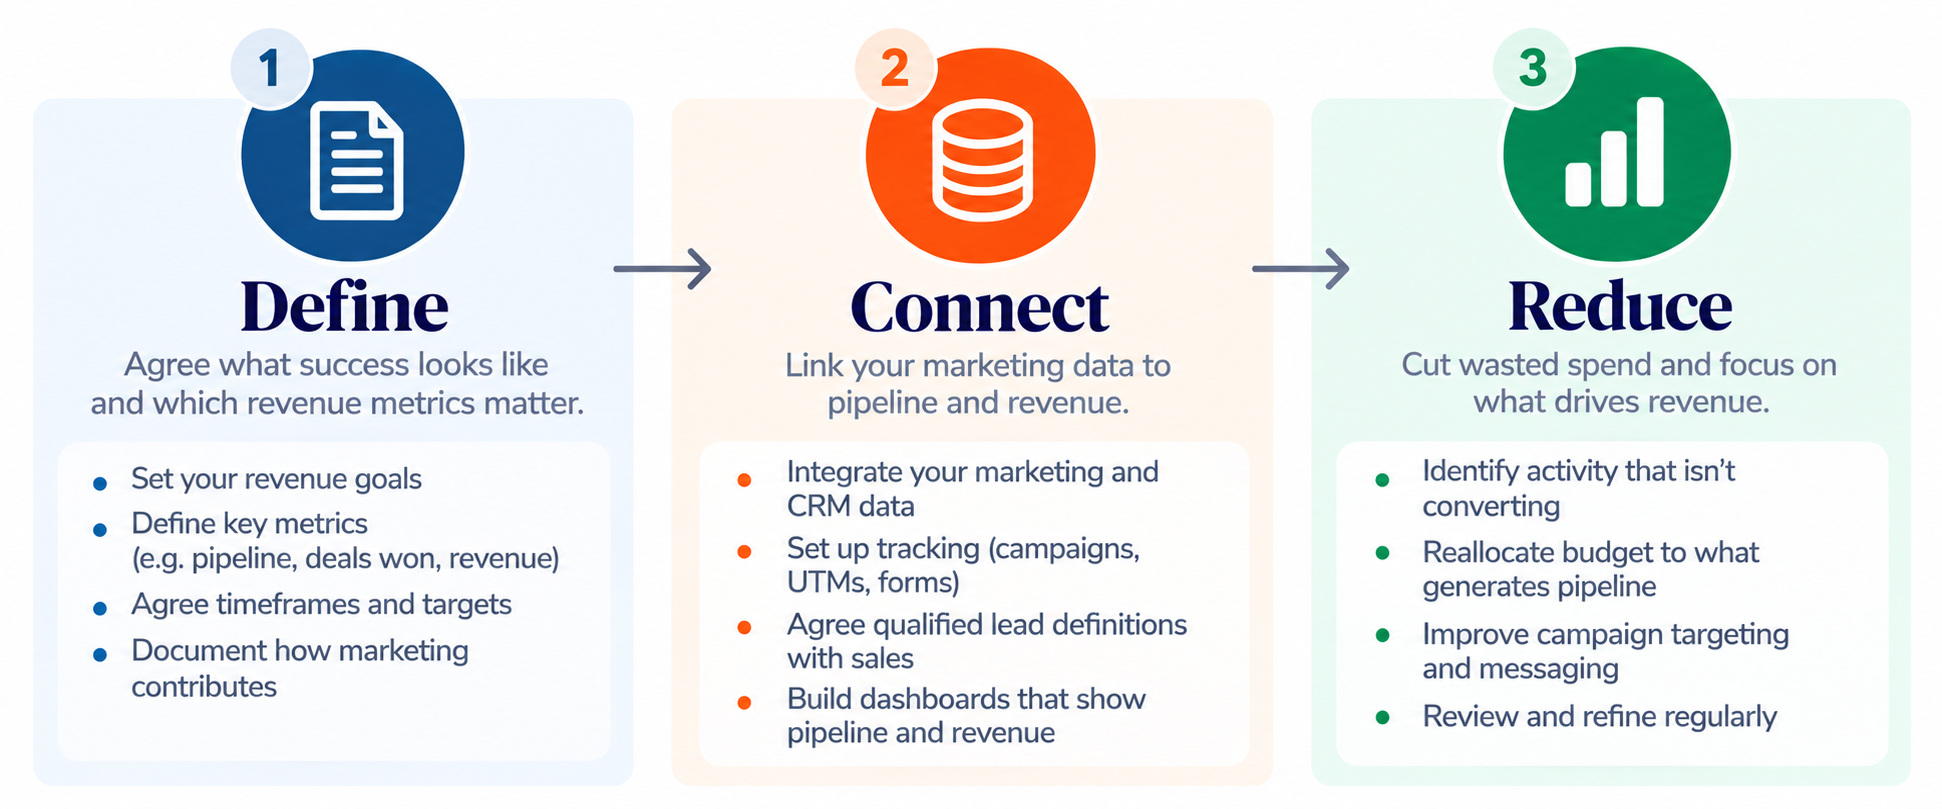
Moving to revenue reporting takes three steps, and most businesses fail at the first one.
- Agree the definitions. Sit sales and marketing in one room and write down what a qualified lead is, with criteria. Most teams never have, which is why letting your agency define a qualified lead is such a structural risk.
- Connect sources to outcomes. Every deal record needs an original source that survives to closed-won. That is CRM configuration work, and it is where most of the effort sits.
- Cut the report down. Reduction comes after connection, not instead of it. Connecting sources produces more metrics, not fewer, so remove every one that does not inform a decision. If nobody can name the action a number would trigger, it is decoration.
Which reporting model should you choose?
Choose revenue reporting as the default, and keep activity metrics as a supporting layer that explains the revenue numbers rather than replacing them.
The test is simple. If your report cannot tell you whether to spend more or less next month, it is a status update, not a report.
This matters more each year, because buyers do most of their evaluation before contacting you. Gartner's research on the B2B buying journey found buyers spend only a small minority of their time with any potential supplier. When the process is that invisible, activity metrics measure noise around a decision you cannot see.
Frequently asked questions
Is attribution ever fully accurate?
No, and any provider claiming otherwise is overselling. Directional accuracy is enough. If one source consistently produces pipeline that closes, you do not need a perfect model to act.
How long before revenue reporting is meaningful?
Roughly one and a half sales cycles in my experience, though that is an observation from client work rather than a published figure. With a three-month cycle, expect useful signal around month four or five.
Should we drop activity metrics entirely?
No. Keep them as diagnostics. When pipeline falls, they tell you where. They explain the result rather than standing in for it.
What if our CRM data is a mess?
Fix that first. Revenue reporting built on unreliable records produces confident numbers that are wrong. Start with one thing: make original source a required field that survives to closed-won, then rebuild the report around deals recorded from that point on.
Where this leaves you
You started with a report you could not argue with and results you could not explain. Activity reporting describes effort. Revenue reporting describes outcome. Only one tells you what to do next.
If step 2 is beyond your team right now, that is common and fixable. Connecting sources to outcomes is a defined piece of configuration work, not an open-ended retainer, and it is usually the cheapest structural fix available. It is also the standard I hold my own reporting to: no vanity metrics, and if a number cannot be explained simply, it is not working properly.
The reason this matters is not the report. It is ownership. A business that cannot explain where its revenue comes from cannot direct its own growth, whoever it pays to run the marketing.
How to take action now
- Count how many figures in last month's report connect to closed revenue.
- Write down your definition of a qualified lead, then ask sales whether they agree.
- Work out your cost per acquired customer for last quarter, even roughly.
- Check whether original source survives to closed-won in your CRM.
- Ask your provider the diagnostic question above, and remove every metric nobody would act on.
Related Reading: Why your sales dashboard looks good but revenue stays flat

Pricing disclaimer: All GBP–USD price conversions are rounded estimates and correct at the time of publishing. Exchange rates fluctuate and figures should be treated as indicative only.